
Blog / Local research
Bend Trades Website Speed Report 2026: 58 Local Homepages on a Phone
Eight of 58 Bend trades homepages scored “good” for phone speed. The typical one takes almost six seconds to show its main content on a slow connection. Here are the numbers and the method.

By Zack Lekas · · 4 min read
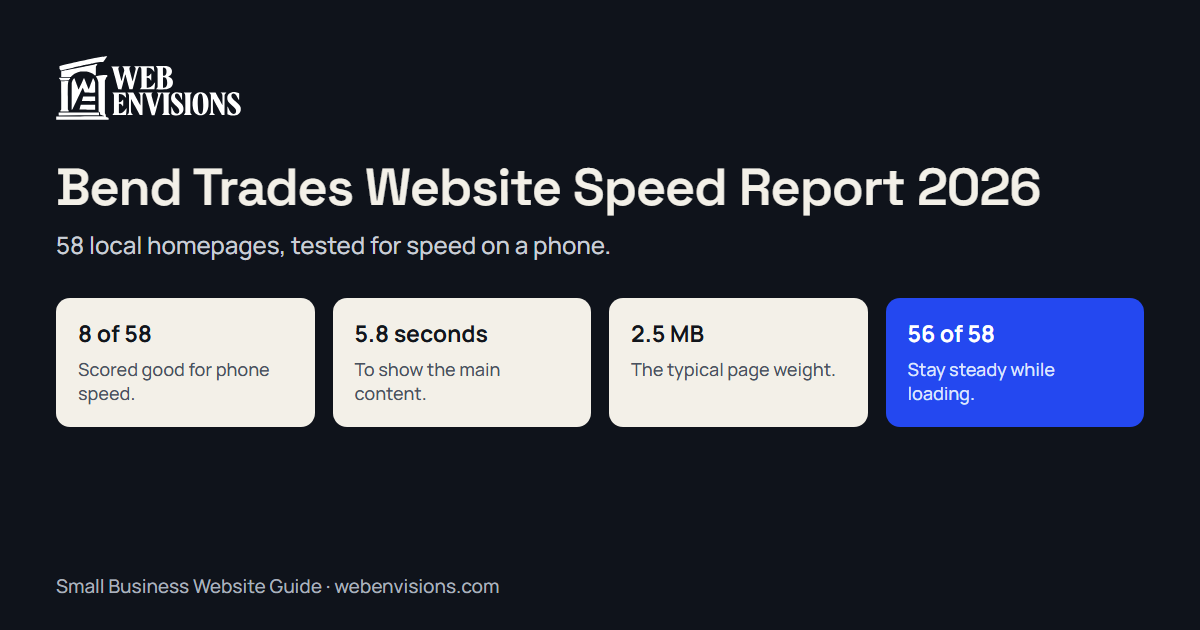
This is the second part of my look at local trades websites. The first part checked what’s on the page. This one measures how fast the page arrives on a phone.
On November 21, 2026, I ran Google’s Lighthouse speed test on the same sample of Bend-area trades homepages. Fifty-eight of the 60 could be measured. No business is named.
The short version
- 8 of 58 scored “good” (90 or above out of 100). 49 scored in the middle band, and 1 scored poor.
- The typical homepage took 5.8 seconds to show its main content in the test. Google’s “good” line is 2.5 seconds. 8 pages met it.
- Pages are heavy. The typical one weighs 2.5 MB. Twelve weigh 5 MB or more, and six weigh 10 MB or more.
- One thing nearly everyone gets right: 56 of 58 pages stay steady while loading, without the layout jumping around.
The scores
| Lighthouse phone score | Sites | Share |
|---|---|---|
| Good (90 to 100) | 8 | 14% |
| Needs improvement (50 to 89) | 49 | 84% |
| Poor (under 50) | 1 | 2% |
The middle score was 72. The lowest was 31 and the highest 99, so a fast trades site is clearly possible.
How long until the main content shows
Lighthouse calls this Largest Contentful Paint: the moment the biggest thing on the first screen, usually the main photo or headline, appears.
| Time to main content | Sites | Share |
|---|---|---|
| 2.5 seconds or less (good) | 8 | 14% |
| 2.5 to 4 seconds | 9 | 16% |
| More than 4 seconds (poor) | 41 | 71% |
Thirteen pages took more than 10 seconds in the test. Remember the test conditions are deliberately harsh, a mid-range phone on a slow connection, so these pages feel faster on good Wi-Fi. But a homeowner in a driveway with two bars is closer to the test than to your office.
Page weight
| Total page weight | Sites |
|---|---|
| Under 1 MB | 6 |
| 1 to 3 MB | 30 |
| 3 to 5 MB | 10 |
| 5 MB or more | 12 |
The typical page made 78 separate requests to load. The heaviest page weighed 64 MB, which is more data than many short videos.
Weight and speed moved together, as you’d expect. The 17 pages under 2 MB had a middle score of 80. The 12 pages of 5 MB or more had a middle score of 70. Weight isn’t the whole story, since some heavy pages load their photos late and still score well, but it’s the first place to look.
What trades sites get right
- Layout stability: 56 of 58 good. Almost nothing jumps as the page loads.
- Responsiveness: 46 of 58 kept the page’s blocking time within Google’s “good” range, meaning the page responds when tapped.
So the problem isn’t broken sites. It’s large photos, sent at full size, at the top of the page.
By platform, with a caution
From the page source, I could tell what most sites were built on. The groups are small, so read this as a sketch, not a ranking.
| Built on | Sites | Middle score |
|---|---|---|
| WordPress | 22 | 72 |
| Other or custom | 11 | 89 |
| Squarespace | 8 | 69 |
| Wix | 7 | 72 |
Groups of three or fewer are left out. What this shows is that no platform guarantees speed. Every one of these groups contains both fast and slow sites. How a site is built and how its photos are prepared matters more than the name on the box.
What I’d do about it
If your site is one of the slow ones, in this order:
- Resize and compress the photos. A phone doesn’t need a 4,000-pixel image. This alone fixes most heavy pages.
- Don’t lead with a slideshow or a video. One strong photo loads faster and says more.
- Load photos further down the page only when they’re scrolled to.
- Remove what you don’t use. Old plugins, unused fonts, chat widgets nobody answers.
- Then look at hosting, if the first response is slow.
Why is my website slow? walks through each of these.
How this was done, and what it can’t tell you
The sample. The same 60 Bend-area trades businesses as the benchmark: taken in order from ten Google searches on November 21, 2026, skipping directories, chains, and businesses with no local base. Two homepages couldn’t be measured: one didn’t load for the test and one never showed content to it.
The test. Lighthouse 13.6, the engine behind Google’s PageSpeed Insights, with its standard phone settings: a simulated mid-range phone on a slow 4G connection. Each homepage was tested once.
The limits, plainly:
- It’s a lab test, not real visitors. It shows how a page behaves under fixed, harsh conditions. Real visitors on fast connections will see better.
- It ran on my computer, not Google’s servers. Google’s own test refused requests at this volume without an account key, so I ran the same engine locally. Scores from PageSpeed Insights for the same page may differ by several points.
- One run each. Lighthouse scores vary from run to run. A site at 88 and a site at 91 are effectively the same.
- Homepage only, and these are sites that already rank on Google. Sites that don’t rank aren’t in here.
- Fifty-eight is a small number. The platform table especially. Treat it as a rough picture.
The wider picture
The Central Oregon Small Business Website Benchmark adds 57 businesses outside the trades, with the same speed test.
Check your own
The free website check runs Google’s phone speed test on your homepage along with the other checks. If speed is what’s holding the site back, website repairs covers the fix, and I’ll tell you if it needs more than that.
All postsNext: Web Designers in Bend, Oregon (2026): 10 Local Studios Compared